

Image Details
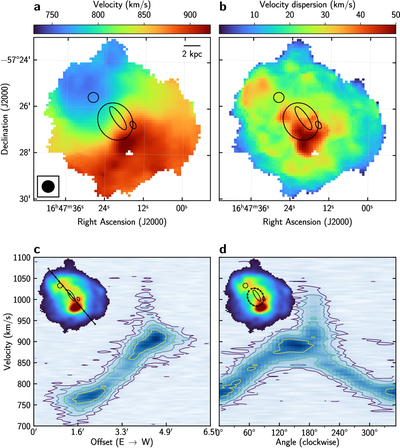
Caption: Figure 4.
H I kinematics of the ESO 179-013 system from ASKAP/WALLABY data; (a) is the flux-weighted velocity field, and (b) is the velocity dispersion map. PV diagrams along the major axis of the ring (c), and along the optical position of the ring (d). Galaxy D is detected as a vertical tail in both panels. The ring shows a sinusoidal pattern that suggests that rotation is the main component of the line-of-sight velocity. The largest ellipse marks the best-fitting optical ellipse of the Hα ring, while the smaller ellipses indicate the optical extents of galaxies B, A, and C (from left to right). North is up, and east is left. The black filled circle is the beam. The contour levels in the PV diagrams are 2n × 3 × 1.8Jy beam−1 (n = 0, 1, 2, 3).
Other Images in This Article
Copyright and Terms & Conditions
© 2026. The Author(s). Published by the American Astronomical Society.

