

Image Details
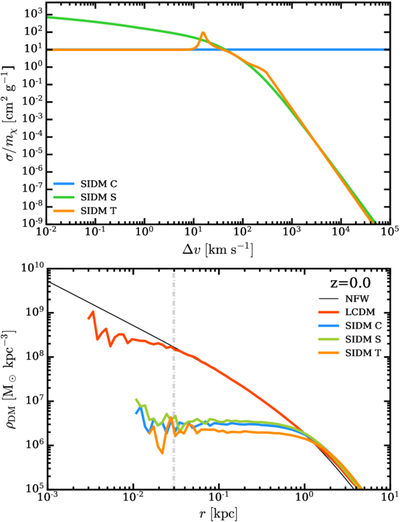
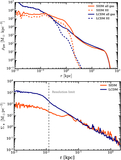
Caption: Figure 1.
Three SIDM models with differing velocity dependency. The top panel shows the cross section as a function of the relative velocity of particles, which is constant for the “SIDM C” (light blue) model and instead has a steep dependence on velocity in “SIDM S” (green) and “SIDM T” (orange). The bottom panel shows the DM density profile at z = 0 of the halo in the DM-only run. In this work, we will study the effects of the “SIDM S” (green) model and its interaction with baryonic physics in more detail.
Other Images in This Article
Copyright and Terms & Conditions
© 2026. The Author(s). Published by the American Astronomical Society.

Copyright ©
2026 Astronomy Image Explorer. All Rights Reserved.
