

Image Details
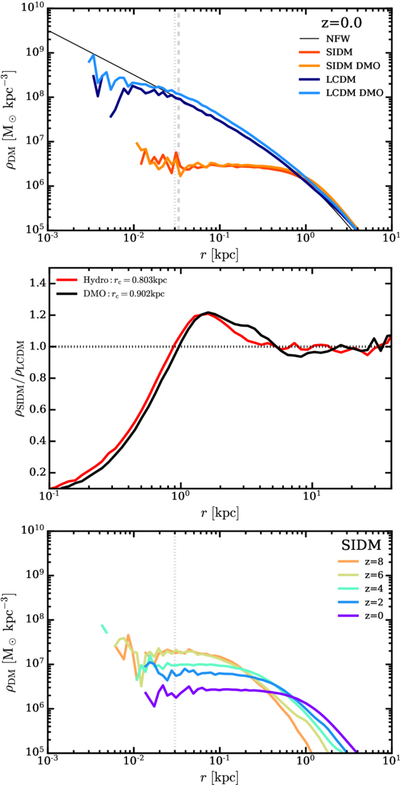
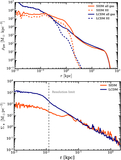
Caption: Figure 2.
Top: DM density profiles. For the DM-only simulations, we have reduced the mass by (1 − ΩB). The SIDM model produces a uniform density region at the center (“core”) out to a radius of approximately 1 kpc. The gray solid line designates 3 times the DM softening length. The dashed gray line encloses 2000 DM particles. Middle: SIDM profile divided by CDM profile for hydrodynamical and DM-only simulations. Core size as shown in the legend is defined as the profile ratio reaching 90%. It is a common SIDM prediction to see a “bump” in the relative profiles where the excess DM that has been pushed out of the core piles up. Bottom: the evolution of the SIDM profile over time. The core is formed very early, before z = 8, and grows in size as the halo grows with time.
Other Images in This Article
Copyright and Terms & Conditions
© 2026. The Author(s). Published by the American Astronomical Society.

