

Image Details
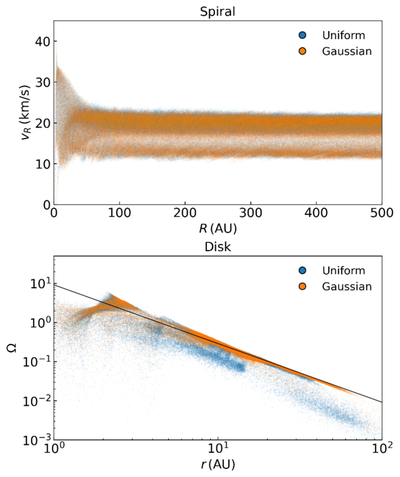
Caption: Figure 3.
Scatter plots of particle velocities in a snapshot at 600 orbital periods. The top panel shows the particle radial velocity (vR) as a function of the spherical radius (R) for runs 1 and 2, which form the spiral structure. The bottom panel shows the particle angular frequency (Ω) as a function of the cylindrical radius (r) for runs 3 and 4, which form circumbinary disks. Blue and orange dots represent the uniform and Gaussian injection cases, respectively. The black line in the bottom panel shows the Keplerian angular frequency for a central object with mass Mb = M1 + M2.
Other Images in This Article
Copyright and Terms & Conditions
© 2026. The Author(s). Published by the American Astronomical Society.

Copyright ©
2026 Astronomy Image Explorer. All Rights Reserved.
