

Image Details
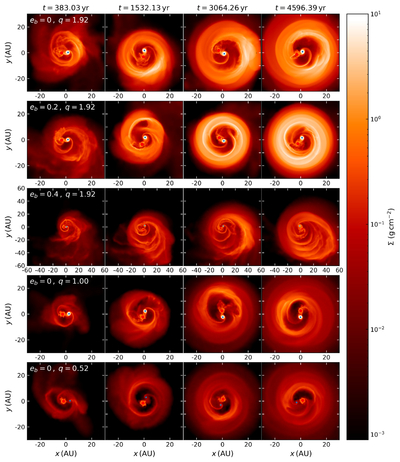
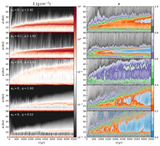
Caption: Figure 4.
Snapshots of projected density for different binary eccentricity eb and mass ratio q. From left to right, the columns correspond to t = 383.03, 1532.13, 3064.26, and 4596.39 yr, (50, 200, 400, and 600 binary orbital periods), respectively. From top to bottom, the rows show the results for models with (eb = 0, q = 1.92), (eb = 0.2, q = 1.92), (eb = 0.4, q = 1.92), (eb = 0, q = 1.00), and (eb = 0, q = 0.52), respectively (runs 5–9).
Other Images in This Article
Copyright and Terms & Conditions
© 2026. The Author(s). Published by the American Astronomical Society.

Copyright ©
2026 Astronomy Image Explorer. All Rights Reserved.
