

Image Details
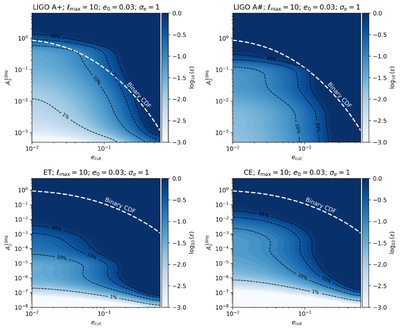
Caption: Figure 5.
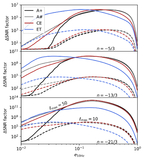
Contours for the fraction ϵ of GW signals within the tail of a realistic eccentricity distribution (see text), that have a phase shift with δSNR > 3, here for an example dephasing with n = −13/3. The high-eccentricity tail is defined by a cutoff value ecut and the results are computed as a function of the dephasing amplitude ﹩{A}_{2}^{10{\rm{H}}z}﹩, here for a representative LVK and CE and ET source consisting of an 8 M⊙ + 8 M⊙ binary placed at z = 0.2 and 3, respectively. Note how focusing on the high-eccentricity sources increases the chances of detecting weaker EEs. The binary cumulative distribution as a function of ecut is overplotted on the contours to highlight the trade-off between the quantity of sources with e10Hz > ecut and the detectability boost for EEs in sources with high eccentricity.
Other Images in This Article
Copyright and Terms & Conditions
© 2026. The Author(s). Published by the American Astronomical Society.

