

Image Details
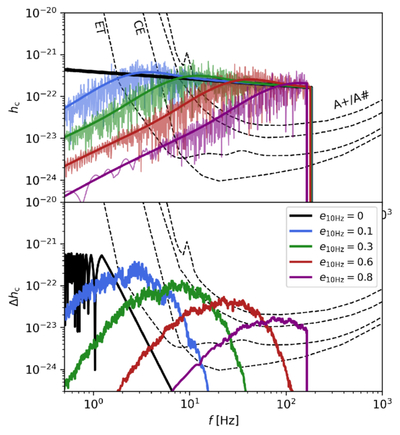
Caption: Figure 2.
Top panel: characteristic strain tracks (given by ﹩\tilde{h}(f)\times f﹩) of an 8 M⊙ + 8 M⊙ binary at z = 0.5 compared to various detector sensitivity curves (dashed lines), for some sample eccentricities at 10 Hz (here meaning when the GW ℓ = 2 harmonic reaches 10 Hz). The solid lines represent the GW envelope, while the thin lines show the interference of the various harmonics. The tracks are truncated at the binary innermost stable circular orbit. Bottom panel: residual strain between the vacuum waveform and the corresponding waveform with a phase shift of 10−3 radians at 10 Hz and a frequency scaling of f−13/3. Note how the residuals are shifted to higher frequencies as the eccentricity increases, entering the band of GW detectors. These particular waveforms are computed with a maximum of 50 harmonics.
Other Images in This Article
Copyright and Terms & Conditions
© 2026. The Author(s). Published by the American Astronomical Society.

