

Image Details
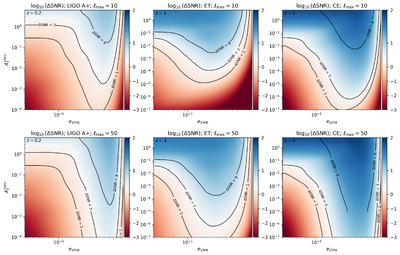
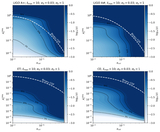
Caption: Figure 3.
Contour plots for the δSNR for a binary source of GW with m1 = m2 = 8 M⊙ located at a typical redshift for the given detector configuration. The contours are computed for a dephasing prescription with n = −13/3, and show the dependence of the δSNR on the magnitude of the dephasing and the eccentricity at 10 Hz. The top row is computed for ﹩{\ell }_{{\rm{\max }}}=10﹩, while the bottom row is for ﹩{\ell }_{{\rm{\max }}}=50﹩. Note how the detectability of the dephasing is greatly increased as soon as significant power is distributed in the higher harmonics of the GW emission, i.e., for eccentricities of ≳0.1. The phase space regions with approximately constant δSNR as a function of ﹩{A}_{2}^{10{\rm{H}}z}﹩ result from the saturation of the eccentric harmonics (see text).
Other Images in This Article
Copyright and Terms & Conditions
© 2026. The Author(s). Published by the American Astronomical Society.

