

Image Details
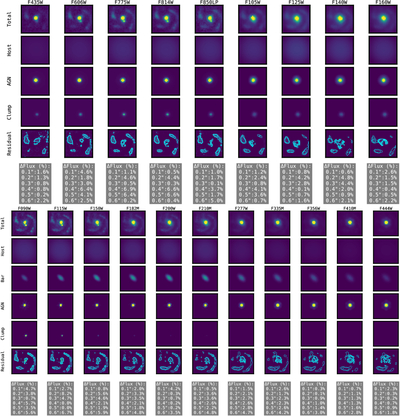
Caption: Figure 11.
AGN–host image decomposition for HST (top) and NIRCam ( bottom) using the more complex models that include additional structural components, namely a clump and, where possible, a bar. Each cutout is 1﹩\mathop{.}\limits^{{\unicode{x02033}}}﹩5 × 1﹩\mathop{.}\limits^{{\unicode{x02033}}}﹩5. For each band, we show the original image (total), the host model, the AGN model, the additional components included in the fit, and the residuals, with contours highlighting residual structures. Owing to the poorer angular resolution of HST, a bar component cannot be robustly fitted in those filters. Similarly, in the NIRCam long-wavelength channel, the broader PSF prevents a reliable fit of the clump component. Although these more complex models provide improved residuals, the added complexity does not lead to significantly different results compared to our baseline decomposition. All cutouts are shown using the same scale as the original image in each band.
Other Images in This Article
Show More
Copyright and Terms & Conditions
© 2026. The Author(s). Published by the American Astronomical Society.

