

Image Details
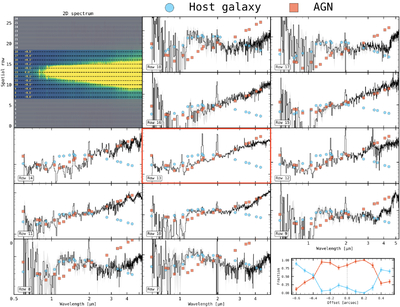
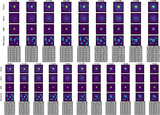
Caption: Figure 4.
Extraction of row-by-row 1D spectra from the NIRSpec/PRISM 2D data of the Saguaro. Spectra are shown in Fλ (y-axis) versus λ (x-axis); spectra are shown in the observed frame. Each subplot on the right shows the extracted spectrum (black) for a given spatial row, along with the corresponding host galaxy and AGN photometry (from GALFITM) normalized (at 2 μm) to match the extracted spectrum at each row. The center of the trace is located at row 13 (highlighted in red). We also report the distance from the center of the spectral trace. We fit the spectrum extracted in each row as a linear combination of the AGN and host components inferred from the GALFITM decomposition. This allows us to estimate the relative AGN and host contributions as a function of distance from the center. We find that the “V-shaped” component dominates in the central row, but becomes diluted at larger radii, where the host contribution takes over.
Other Images in This Article
Show More
Copyright and Terms & Conditions
© 2026. The Author(s). Published by the American Astronomical Society.

