

Image Details
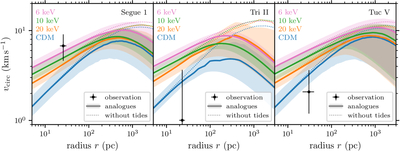
Caption: Figure 7.
Radial profiles of the circular orbit velocity vcirc for GALACTICUS analogs of Segue 1 (left-hand panel), Tri II (middle panel), and Tuc V (right-hand panel). The solid curves show the median value at each radius, while the shading marks the 1σ (68%) scatter. Different colors correspond to different dark matter models. For comparison, the dotted curves show the median profiles prior to tidal evolution. The black points with error bars represent the 1σ range of the observationally inferred circular orbit velocity at the half-light radius, per Section 2.
Other Images in This Article
Show More
Copyright and Terms & Conditions
© 2026. The Author(s). Published by the American Astronomical Society.

Copyright ©
2026 Astronomy Image Explorer. All Rights Reserved.
