

Image Details
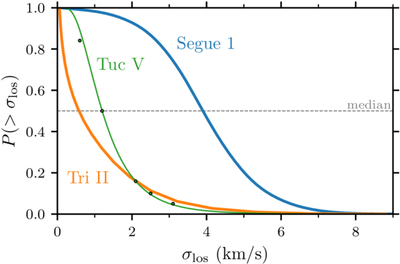
Caption: Figure 3.
Cumulative posterior distributions of the line-of-sight velocity dispersion of the dwarf galaxies that we analyze. For Segue 1 and Tri II, we take the distributions directly from J. D. Simon et al. (2011) and R. Buttry et al. (2022), respectively. For Tuc V, the points correspond to the values reported by T. T. Hansen et al. (2024), and we adopt a closely matching log-normal distribution (green curve).
Other Images in This Article
Show More
Copyright and Terms & Conditions
© 2026. The Author(s). Published by the American Astronomical Society.

Copyright ©
2026 Astronomy Image Explorer. All Rights Reserved.
