

Image Details
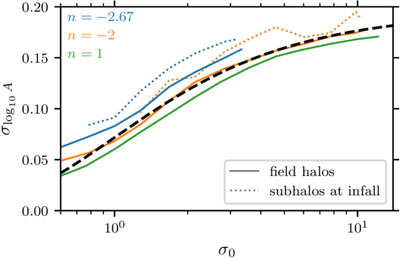
Caption: Figure 9.
68% scatter in cusp coefficients A at fixed halo mass, shown as a function of time. The solid curves include all field halos, while the dotted curves are restricted to halos that will fall into another halo at least 100 times more massive in the next 3%–6% of a Hubble time. The dashed curve represents Equation (A2).
Other Images in This Article
Show More
Copyright and Terms & Conditions
© 2026. The Author(s). Published by the American Astronomical Society.

Copyright ©
2026 Astronomy Image Explorer. All Rights Reserved.
