Image Details
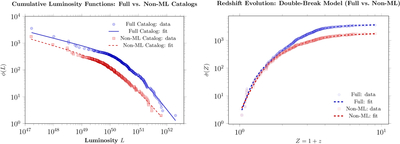
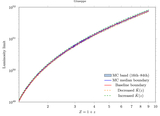
Caption: Figure 7.
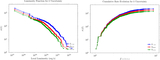
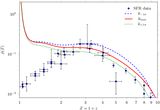
Left: formation rates derived from the C− method for both the full (blue) and non-ML (red) GRB catalogs. The solid curves indicate the best-fit double-break power-law models. Cumulative luminosity functions for the GRB catalogs. Blue points with a solid fit line represent the full catalog, while red squares with a dashed fit line represent the non-ML subset. Both are fitted with a smooth double power-law model. Right: formation rates derived from the C− method for both the full (blue) and non-ML (red) GRB catalogs. The solid curves indicate the best-fit double-break power-law models.
Other Images in This Article
Copyright and Terms & Conditions
© 2026. The Author(s). Published by the American Astronomical Society.
Copyright ©
2026 Astronomy Image Explorer. All Rights Reserved.