Image Details
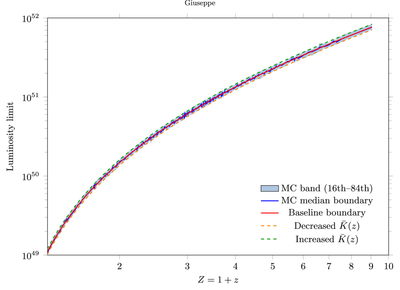
Caption: Figure 4.
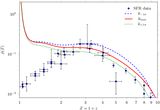
Sensitivity of the EP luminosity-limit boundary to perturbations in the fitted average K-correction. The baseline boundary is constructed using the power-law fit to the running average ﹩\overline{K(Z)}﹩, while the shaded band shows the 16th–84th percentile range from Monte Carlo perturbations of ﹩\overline{K(Z)}﹩ within the measured log-space scatter. The median perturbed boundary and representative systematic perturbations remain close to the baseline curve, indicating that the associated sets used in the EP statistic are not strongly affected by reasonable variations in the adopted smooth representation of ﹩\overline{K(Z)}﹩.
Other Images in This Article
Copyright and Terms & Conditions
© 2026. The Author(s). Published by the American Astronomical Society.