Image Details
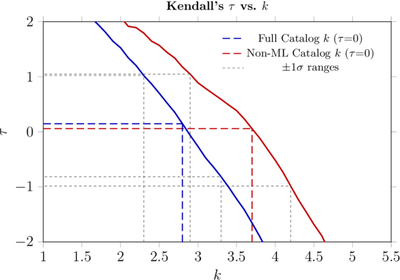
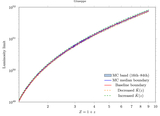
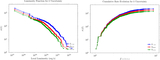
Caption: Figure 6.
Kendall’s τ statistic as a function of k for the full GRB catalog (blue) and the non-ML subset (red). Solid curves show the measured τ(k). Dashed lines indicate the central (fit) guides for each dataset, while the lighter dashed bands denote the corresponding ±1σ ranges.
Other Images in This Article
Copyright and Terms & Conditions
© 2026. The Author(s). Published by the American Astronomical Society.
Copyright ©
2026 Astronomy Image Explorer. All Rights Reserved.