

Image Details
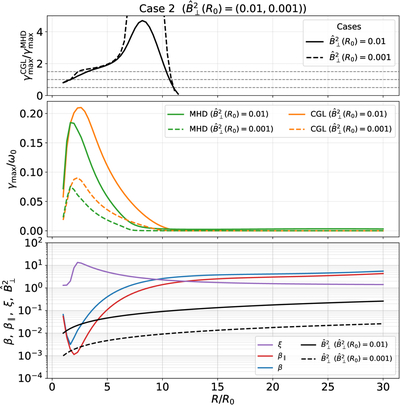
Caption: Figure 3.
Radial evolution of the maximum growth rate and the background plasma parameters for Case 2 with ﹩{\hat{B}}_{\perp }^{2}({R}_{0})=0.01﹩ and 0.001. The upper panel shows the ratio of the maximum growth rate in the CGL model to that in the ideal-MHD model, ﹩{\gamma }_{{\rm{\max }}}^{{\rm{CGL}}}/{\gamma }_{{\rm{\max }}}^{{\rm{MHD}}}﹩. The three gray horizontal dashed lines indicate 0.5, 1, and 1.5, respectively. The solid and dashed lines correspond to ﹩{\hat{B}}_{\perp }^{2}({R}_{0})=0.01﹩ and 0.001, respectively. The middle panel presents the radial evolution of the maximum growth rate in both models: the green curves denote the ideal-MHD results, whereas the orange curves denote the CGL results. The lower panel shows the radial evolution of the local background parameters used to evaluate the maximum growth rate. The purple curve indicates the temperature anisotropy ξ ≡ T⊥0/T∥0. The black curve indicates ﹩{\hat{B}}_{\perp }^{2}﹩ (here ﹩{\hat{B}}_{\perp }^{2}({R}_{0})=0.01\,\mathrm{and}\,0.001﹩); these two profiles are common to both the ideal-MHD and CGL models. The red and blue curves represent β∥ and β, respectively.
Other Images in This Article
Copyright and Terms & Conditions
© 2026. The Author(s). Published by the American Astronomical Society.

