

Image Details
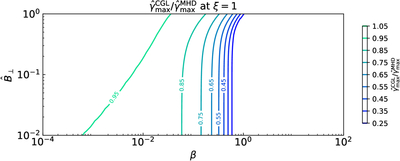
Caption: Figure 8.
This figure presents a contour plot of ﹩{\gamma }_{{\rm{\max }}}^{{\rm{CGL}}}/{\gamma }_{{\rm{\max }}}^{{\rm{MHD}}}﹩ (contour intervals of Δ = 0.1) for ξ = 1. The vertical axis shows ﹩{\hat{B}}_{\perp }﹩ over the range [0.01, 1], and the horizontal axis shows β over the range [10−4, 102].
Other Images in This Article
Copyright and Terms & Conditions
© 2026. The Author(s). Published by the American Astronomical Society.

Copyright ©
2026 Astronomy Image Explorer. All Rights Reserved.
