

Image Details
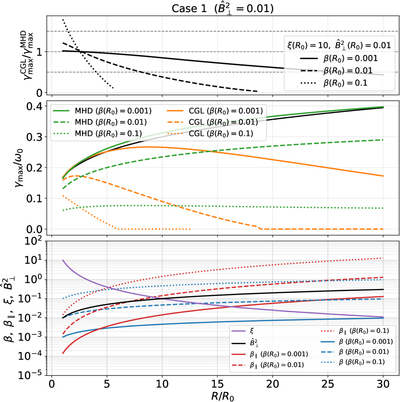
Caption: Figure 1.
Radial evolution of the maximum growth rate and the corresponding background plasma parameters for Case 1 with β(R = R0) = 0.001, 0.01, and 0.1, ξ(R0) = 10, and ﹩{\hat{B}}_{\perp }^{2}({R}_{0})=0.01﹩. The upper panel shows the ratio of the maximum growth rate in the CGL model to that in the ideal-MHD model, ﹩{\gamma }_{{\rm{\max }}}^{{\rm{CGL}}}/{\gamma }_{{\rm{\max }}}^{{\rm{MHD}}}﹩. The three gray horizontal dashed lines indicate 0.5, 1, and 1.5, respectively. The solid, dashed, and dotted lines correspond to β(R0) = 0.001, 0.01, and 0.1, respectively. The middle panel presents the radial evolution of the maximum growth rate in both models: the green curves denote the ideal-MHD results, whereas the orange curves denote the CGL results. The solid black line is an auxiliary line corresponding to ﹩{\gamma }_{{\rm{\max }}}/{\omega }_{0}\propto {R}^{1/4}﹩. Green and orange solid, dashed, and dotted lines correspond to β(R0) = 0.001, 0.01, and 0.1, respectively. The lower panel shows the radial evolution of the local background parameters used to evaluate the maximum growth rate. The purple curve indicates the temperature anisotropy ξ ≡ T⊥0/T∥0 (here ξ(R0) = 10), and the black curve indicates ﹩{\hat{B}}_{\perp }^{2}﹩ (here ﹩{\hat{B}}_{\perp }^{2}({R}_{0})=0.01﹩); these two profiles are common to both the ideal-MHD and CGL models. The red and blue curves represent β∥ and β, respectively, and the solid, dashed, and dotted line styles follow the same convention as in the middle panel.
Other Images in This Article
Copyright and Terms & Conditions
© 2026. The Author(s). Published by the American Astronomical Society.

