Image Details
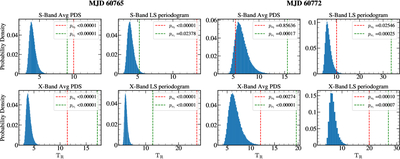
Caption: Figure 3.
The distributions of the maximum TR from each simulated data for the corresponding wave bands. ﹩{T}_{{\rm{R}}}={\rm{\max }}(2{I}_{j}/{S}_{j})﹩ is calculated from each simulated PDS and LS periodogram, where Ij is the power at frequency fj and Sj is the best-fit power-law value at that frequency. The dashed red and green lines indicate ﹩{T}_{{\rm{R}}}^{{\rm{obs}}}﹩ at the fundamental and harmonic frequencies, respectively.
Other Images in This Article
Copyright and Terms & Conditions
© 2026. The Author(s). Published by the American Astronomical Society.
Copyright ©
2026 Astronomy Image Explorer. All Rights Reserved.