Image Details
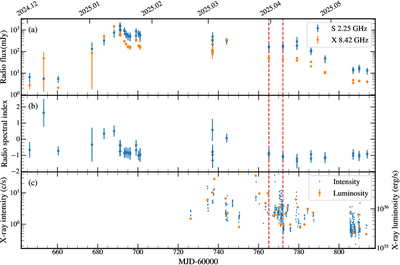
Caption: Figure 1.
The radio and X-ray light curves of the 2025 flare from MJD 60646 to MJD 60814. The two dashed red lines mark the observation dates with QPO detection. (a) The radio flux densities at 2.25 and 8.42 GHz. (b) The radio spectral index. (c) The blue points represent the NICER light curve of the count rate, and the orange points represent the luminosity in the energy band 1–10 keV.
Other Images in This Article
Copyright and Terms & Conditions
© 2026. The Author(s). Published by the American Astronomical Society.
Copyright ©
2026 Astronomy Image Explorer. All Rights Reserved.