Image Details
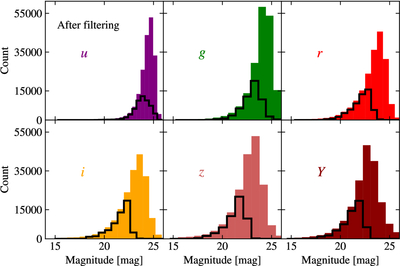
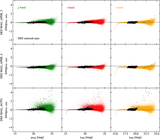
Caption: Figure 4.
Distribution of magnitude values for each band. The colored bars represent the dataset before the preprocessing described in Section 2.4. The black edges indicate the subset that represents the dataset after all the filtering; it contains only the labeled sources.
Other Images in This Article
Show More
Copyright and Terms & Conditions
© 2026. The Author(s). Published by the American Astronomical Society.
Copyright ©
2026 Astronomy Image Explorer. All Rights Reserved.