Image Details
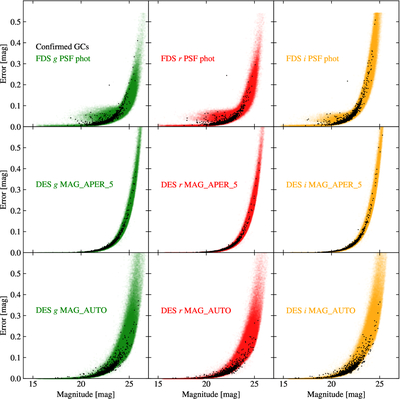
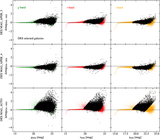
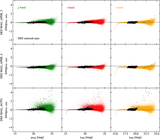
Caption: Figure 2.
Magnitude errors plotted vs. magnitudes for the bands in common between DES and FDS, gri. Black dots represent confirmed GCs. The first row of plots refers to FDS PSF photometry data, the second to DES circular aperture photometry, and the third to DES automatic aperture (based on the Kron radius) photometry. For visualization purposes, the magnitude error axes were truncated at a value of 0.6 mag. Errors in FDS data do not exceed 0.6 mag: All FDS data points are visible in these plots.
Other Images in This Article
Show More
Copyright and Terms & Conditions
© 2026. The Author(s). Published by the American Astronomical Society.
Copyright ©
2026 Astronomy Image Explorer. All Rights Reserved.