Image Details
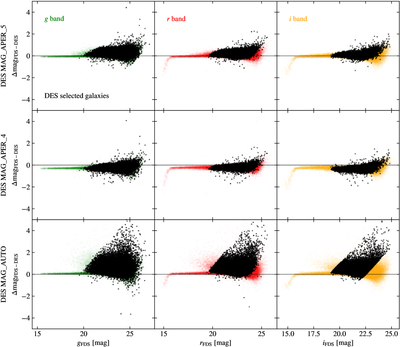
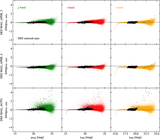
Caption: Figure 8.
ΔmagFDS−DES vs. g, r, iFDS: the difference in magnitude for the same source, in the same band, but in different surveys against the FDS magnitude in the same band. The first row displays the plots where DES MAG_APER_5 (2﹩\mathop{.}\limits^{\unicode{x02033}}﹩92) data were used, the second DES MAG_APER_4 (1﹩\mathop{.}\limits^{\unicode{x02033}}﹩92), and the third DES MAG_AUTO. Black points denote background galaxies selected via Criterion (1), as in Section 2.2. The horizontal black line is y = 0.
Other Images in This Article
Show More
Copyright and Terms & Conditions
© 2026. The Author(s). Published by the American Astronomical Society.
Copyright ©
2026 Astronomy Image Explorer. All Rights Reserved.