Image Details
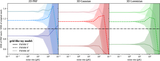
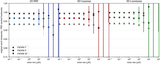
Caption: Figure 8.
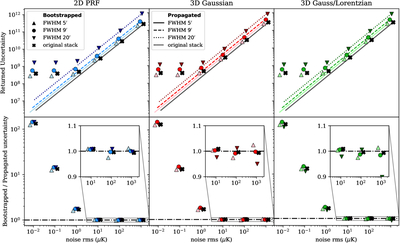
Uncertainties returned from error propagation compared to the uncertainties from bootstrapping for each stacking method. Points are slightly offset in the x-axes for clarity Top: returned uncertainties as a function of map rms noise, for each of the three stacking methods. Points indicate bootstrapped uncertainties, and lines propagated uncertainties. The original stack (using a 5 × 5 × 3 aperture) is shown in gray for comparison. Bottom: ratios between bootstrapped and propagated uncertainties. Where the map rms dominates the uncertainty (above ∼10 μK), the propagated uncertainties agree well with the bootstraps. The inset axes show that the ratio between bootstrapped and propagated uncertainties is nearly 1 for all permutations. Below ∼10 μK, variance in the signal itself (reflected only in the bootstraps) begins to dominate.
Other Images in This Article
Copyright and Terms & Conditions
© 2026. The Author(s). Published by the American Astronomical Society.