Image Details
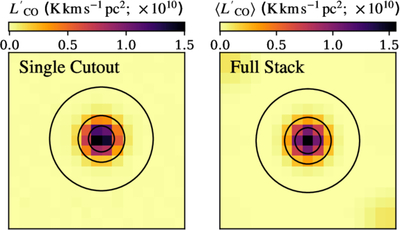
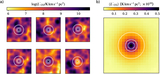
Caption: Figure 2.
The toy model simulation. The left panel shows a single stack cutout, collapsed across the spectral axis to form a 2D image. The right panel shows a the full 2000-object stack by the original stacking method. In both cases, ellipses showing the FWHMs of ﹩{5}^{{\prime} }﹩, ﹩{9}^{{\prime} }﹩, and ﹩2{0}^{{\prime} }﹩ Gaussian profiles are shown, centered around the location of the point source (or stack centroid, respectively) in the simulated catalog. Note that in the case of the single cutout, the subpixel offsets we add to the simulated sources mean that the location of the point source is not centered within its voxel.
Other Images in This Article
Copyright and Terms & Conditions
© 2026. The Author(s). Published by the American Astronomical Society.