Image Details
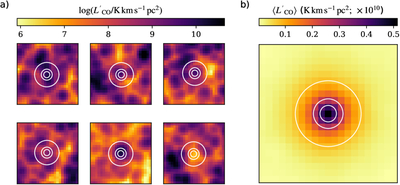
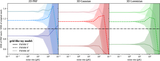
Caption: Figure 5.
“Realistic” simulated LIM cube for an LAE population, and the resulting stack. The left panels (a) show the simulations at the positions of six individual LAEs in the mock catalog. The white circles in each cutout are at the characteristic beam sizes tested in this work (﹩{5}^{{\prime} }﹩, ﹩{9}^{{\prime} }﹩, and ﹩2{0}^{{\prime} }﹩), each centered around the position of the LAE in the data cube. Note the logarithmic color scaling. The innermost circle (the ﹩{5}^{{\prime} }﹩ FWHM) is the simulated instrumental beam used in the simulations. The right panel (b) shows the spatial distribution of the signal resulting from a stack on 2000 mock LAEs. Again, circles with FWHMs of ﹩{5}^{{\prime} }﹩, ﹩{9}^{{\prime} }﹩, and ﹩2{0}^{{\prime} }﹩ are shown, with ﹩{5}^{{\prime} }﹩ corresponding to the instrumental beam. The stacked signal extends well past this point.
Other Images in This Article
Copyright and Terms & Conditions
© 2026. The Author(s). Published by the American Astronomical Society.