Image Details
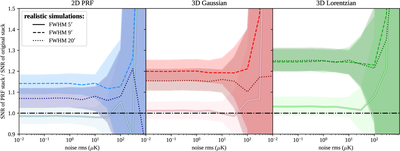
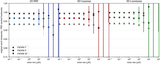
Caption: Figure 7.
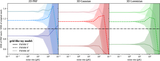
Ratio of SNR recovered by PRF stacking methods with different widths to the SNR of the original (3 × 5 × 5) stack across noise levels (similar to Figure 4), using the realistic simulations of Section 4. The curves and shaded areas show median and 68% interval values across 100 simulations of ratios of SNR for the stack method indicated by the line style and panel title. A horizontal line (black, dashed–dotted) marks a ratio of 1.
Other Images in This Article
Copyright and Terms & Conditions
© 2026. The Author(s). Published by the American Astronomical Society.
Copyright ©
2026 Astronomy Image Explorer. All Rights Reserved.