Image Details
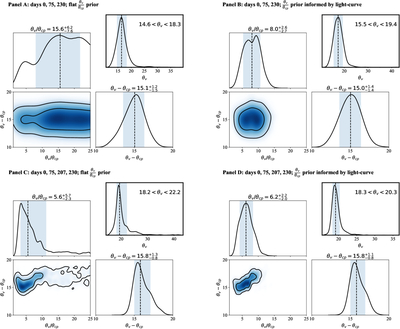
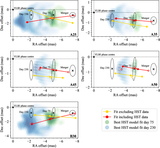
Caption: Figure 1.
Corner plots of the θv − θcp (in degrees) and ﹩\tfrac{{\theta }_{\,\rm{v}}}{{\theta }_{\rm{cp}\,}}﹩ posteriors resulting from fits that include (panels (A) to (D)): (A) HSA and HST data (days 0, 75, 230), (B) same but with ﹩\tfrac{{\theta }_{\,\rm{v}}}{{\theta }_{\rm{cp}\,}}﹩ priors informed by the afterglow light curve, (C) all astrometric data (days 0, 75, 207, 230), (D) same but with ﹩\tfrac{{\theta }_{\,\rm{v}}}{{\theta }_{\rm{cp}\,}}﹩ priors informed by the afterglow light curve. The corresponding viewing angle (θv) posterior samples, recovered algebraically by rearranging the ﹩\tfrac{{\theta }_{\,\rm{v}}}{{\theta }_{\rm{cp}\,}}﹩ and θv − θcp posterior samples, are represented by a histogram in the top right corner of each subfigure. The posterior median and 68% credible interval are reported and denoted by vertical dashed lines and shaded regions in the histograms, respectively. The corner plot contours denote the 68% and 95% credible levels. All four fits included here used the power-law (b = 6) jet model family. These posterior distributions are visualized using GETDIST, which employs adaptive KDE to generate smooth approximations to the underlying distributions. These smoothed curves are used exclusively for visualization purposes. All quoted parameter estimates and credible intervals are computed directly from the posterior samples.
Other Images in This Article
Copyright and Terms & Conditions
© 2026. The Author(s). Published by the American Astronomical Society.