Image Details
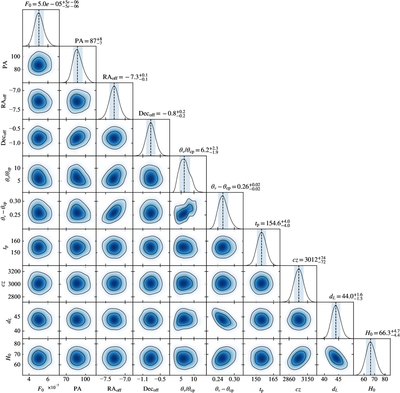
Caption: Figure 6.
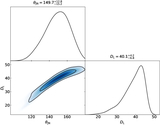
Example corner plot of key model parameters’ posteriors of a fit from Section 3.2. The parameters are described in Table 3 and Section 2. These results are generated using the peculiar velocity correction model with the largest Bayes evidence of the 28 corrections that were considered in Section 3.2. The posterior median and 68% credible interval are reported above each histogram and are denoted in the histograms by a vertical dotted line and shading, respectively. The corner plot contours correspond to the 68% and 95% credible intervals.
Other Images in This Article
Copyright and Terms & Conditions
© 2026. The Author(s). Published by the American Astronomical Society.
Copyright ©
2026 Astronomy Image Explorer. All Rights Reserved.