Image Details
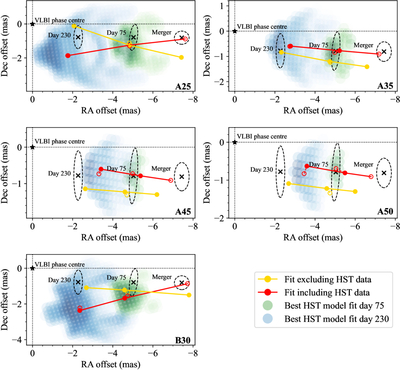
Caption: Figure 5.
Reanalysis of the afterglow models originally analyzed in K. P. Mooley et al. (2018) (labeled in the bottom-right corner of each panel). The black X-shaped markers are the image-plane positions of GW170817 with their uncertainty ellipses and are the same as described in the caption of Figure 2. The closed yellow points correspond to the resulting best-fit position (the flux centroid of the fitted model) when the model reference position offset (R.A.off, decl.off) is a free parameter with uninformative priors. The open yellow circle denotes the posterior probability of the astrometric nuisance parameter (δra,i,δdec,i) pair associated with the VLBI data (with priors that capture the astrometric systematic uncertainties of both epochs added in quadrature, as opposed to fitting two separate pairs). The red data points correspond to the same, but when the fit is anchored to the HST kilonova/merger position (Appendix A.2). The closed red VLBI circles represent the flux centroid of the model referenced to the fitted HST position (rightmost open red circle; (R.A.off, decl.off)). The open red VLBI circles include the respective posterior probabilities of the VLBI astrometric nuisance parameters, and thus represent where the centroid would appear on the sky after including the systematic error inferred for the data on that date. In each panel, the corresponding afterglow model images are represented by shaded green (day 75) and blue (day 230) background circles. The shaded models shown in the background are plotted using the latter best-fit positions.
Other Images in This Article
Copyright and Terms & Conditions
© 2026. The Author(s). Published by the American Astronomical Society.