Image Details
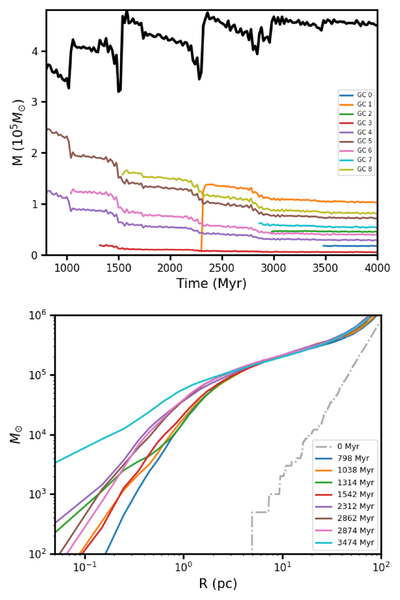
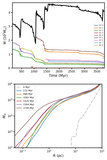
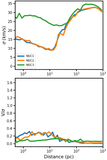
Caption: Figure 7.
Top panel: time evolution of NSC2 total mass (black solid line) and individual contribution to the total mass of NSC2 by each GC within 50 pc. Bottom panel: cumulative mass profile of the NSC2 immediately after each GC merger.
Other Images in This Article
Copyright and Terms & Conditions
© 2026. The Author(s). Published by the American Astronomical Society.
Copyright ©
2026 Astronomy Image Explorer. All Rights Reserved.