Image Details
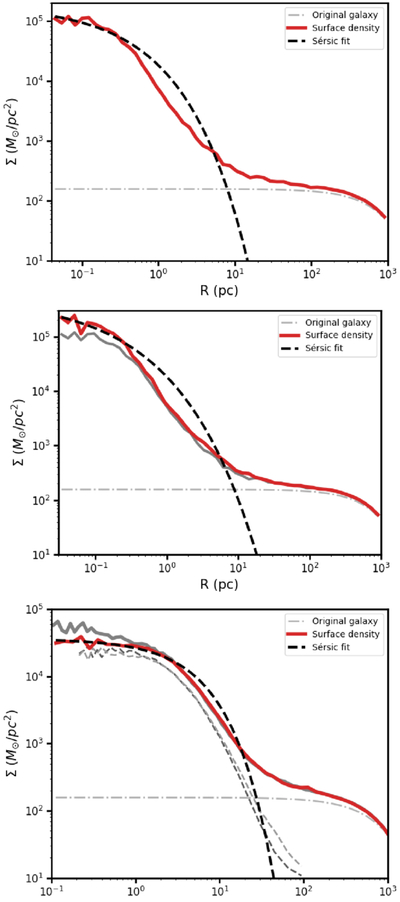
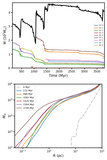
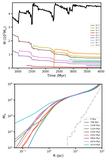
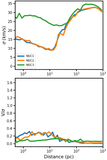
Caption: Figure 5.
Surface-density profile of UGC 7346 + NSC1, NSC2, and NSC3 (from top to bottom, respectively). Dashed–dotted line shows the surface brightness profile of UGC 7346 at t = 0. Middle panel: surface density of NSC1 is shown as a solid gray line for comparison. Bottom panel: solid gray line represents the surface density of NSC3 at 1.6 Gyr. Thin dashed lines show the surface density of the clusters C1 and C2 observed in IC 3.
Other Images in This Article
Copyright and Terms & Conditions
© 2026. The Author(s). Published by the American Astronomical Society.
Copyright ©
2026 Astronomy Image Explorer. All Rights Reserved.