Image Details
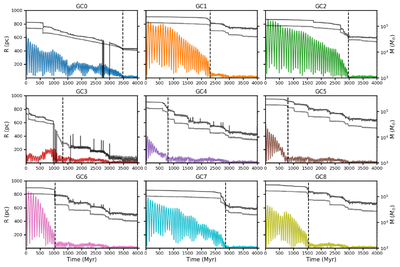
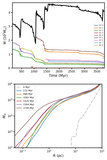
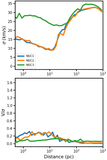
Caption: Figure 6.
Twin-axis plot of orbital decay and mass loss of GCs in IC 2. Dark- and light-gray lines represent the total mass within tidal radius and 5Re (equivalent to half-mass radius). Vertical dashed lines represent the time each GC merged at the center.
Other Images in This Article
Copyright and Terms & Conditions
© 2026. The Author(s). Published by the American Astronomical Society.
Copyright ©
2026 Astronomy Image Explorer. All Rights Reserved.