Image Details
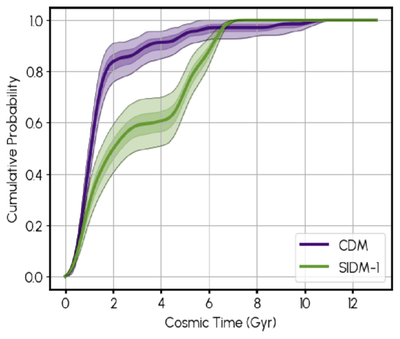
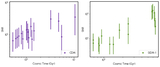
Caption: Figure 3.
We plot the distribution of 10,000 empirical CDFs for cosmic times of 70 MBH mergers, CDM (purple), and SIDM-1 (green). The darker regions contain the 25th and 75th percentiles, whereas the lighter regions enclose the 5th and 95th percentiles. The dark line traces the 50th percentile.
Other Images in This Article
Copyright and Terms & Conditions
© 2026. The Author(s). Published by the American Astronomical Society.
Copyright ©
2026 Astronomy Image Explorer. All Rights Reserved.