Image Details
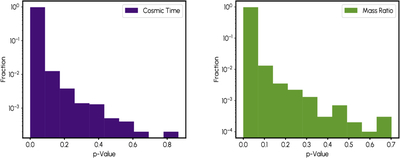
Caption: Figure 6.
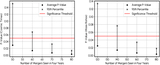
Here we show the distribution of p-values for comparing cosmic times (left) and comparing mass ratios (right). For cosmic times, this corresponds to ∼70 mergers, whereas for mass ratios, this corresponds to ∼160 mergers. These plots show the fraction of the 10,000 p-values that live in each bin.
Other Images in This Article
Copyright and Terms & Conditions
© 2026. The Author(s). Published by the American Astronomical Society.
Copyright ©
2026 Astronomy Image Explorer. All Rights Reserved.