

Image Details
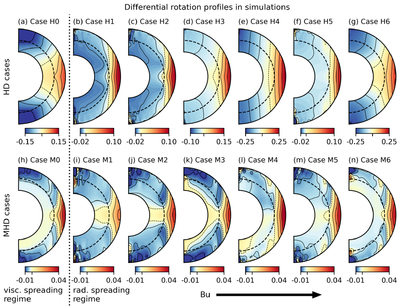
Caption: Figure 4.
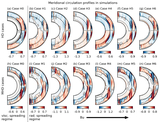
Steady-state differential rotation ﹩{\left\langle 2{\rm{\Omega }}-1\right\rangle }_{t}﹩ for the full simulation suite, plotted in the meridional plane. Red/yellow/blue tones indicate positive/zero/negative values. The outer ticks in each color bar mark the saturation values (which are labeled) and the inner tick marks zero. Contours are equally spaced (for positive and negative values separately) and the zero contour is dashed. The dashed interior semicircle marks r = rbcz. A dotted vertical line separates the viscous spreading regime (Case 0) from the radiative spreading regime (Cases 1–6). In the radiative spreading regime, the stratification (Bu) mostly increases to the right, as shown schematically by the arrow.
Other Images in This Article
Show More
Copyright and Terms & Conditions
© 2026. The Author(s). Published by the American Astronomical Society.

