

Image Details
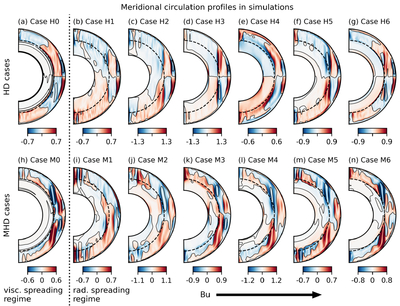
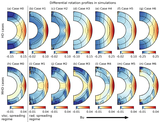
Caption: Figure 6.
Time-averaged meridional circulation profiles ﹩| {\left\langle \tilde{\rho }{{\boldsymbol{u}}}_{{\rm{m}}}\right\rangle }_{t}| \,\rm{sgn}\,({\left\langle {\rm{\Psi }}\right\rangle }_{t})﹩ (see Equations (36) and (37)) for the full simulation suite, plotted in the meridional plane. Red tones indicate clockwise circulation and blue tones indicate counterclockwise circulation. The solid contours mark ﹩{\left\langle {\rm{\Psi }}\right\rangle }_{t}\equiv 0﹩, which are the circulation cell boundaries and also streamlines of um. The dashed semicircles mark r = rbcz.
Other Images in This Article
Show More
Copyright and Terms & Conditions
© 2026. The Author(s). Published by the American Astronomical Society.

Copyright ©
2026 Astronomy Image Explorer. All Rights Reserved.
