

Image Details
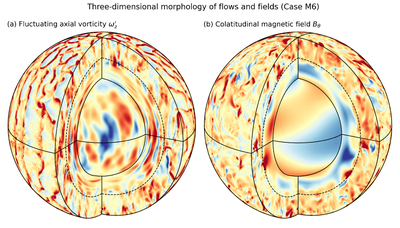
Caption: Figure 3.
Spherical and meridional surfaces cut out of the simulation domain showing snapshots of the simulated flows in Case M6 for (a) the fluctuating axial vorticity ﹩{\omega }_{z}^{\prime} ﹩ and (b) the colatitudinal component of the poloidal magnetic field Bθ. Red/yellow/blue tones indicate positive/zero/negative values. Each snapshot is taken toward the end of the simulation (t = trun). The inner and outer spherical surfaces bounding the shell are taken just above and below the inner and outer domain boundaries rin and rout, respectively. The meridional surfaces are located 90° apart, at ϕ = −30° and ϕ = 60° (with ϕ = 0° being the central viewing longitude; the central viewing latitude is 20° north). Each radial level is normalized separately by the rms of the field at that level, leading to enhanced signal from the deeper regions, whose flows and fields are in fact of much weaker amplitude than they are higher up. The interface r = rc is marked by dashed black curves. In the 26 s animation, the short-term evolution of ﹩{\omega }_{z}^{\prime} ﹩ (t = 46,542 to t = 46,702) and long-term evolution of Bθ (t = 0 to t = 17,023) are shown side by side. Animated versions of the separate panels are also available for download at doi:10.5281/zenodo.18265773 and for viewing at https://www.youtube.com/shorts/z425Iy9Loc4 (short-term evolution of ﹩{\omega }_{z}^{\prime} ﹩), https://www.youtube.com/shorts/BQfHSm4_I0o (long-term evolution of Bθ), and https://www.youtube.com/shorts/WjBdOqFB_Yo (short-term evolution of Bθ).
(An animation of this figure is available in the online article.)
(An animation of this figure is available.)
The video/animation of this figure is available in the online journal.
Other Images in This Article
Show More
Copyright and Terms & Conditions
© 2026. The Author(s). Published by the American Astronomical Society.

