

Image Details
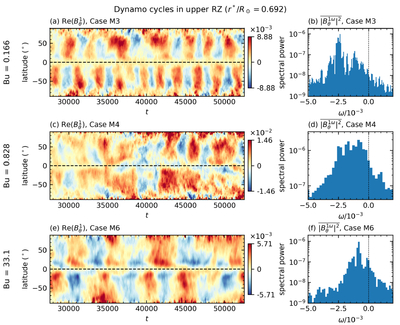
Caption: Figure 11.
Time–latitude diagrams over the interval t = (27500, 52500) of ﹩{\rm{Re}}({B}_{\theta }^{1})﹩ in the upper RZ (﹩{r}^{\ast }﹩/R⊙ = 0.692) and the corresponding truncated horizontally averaged power spectra in frequency ﹩{\left\langle {\left|{B}_{\theta }^{1\omega }\right|}^{2}\right\rangle }_{{\rm{sph}}}﹩ for (a)–(b) Case M3, (c)–(d) Case M4, and (e)–(f) Case M6. The full time series t = (0, trun) was used to obtain the frequency spectra and a Hanning window function was employed to reduce high-frequency noise. For Cases M3, M4, and M6, respectively, the frequency resolution (the width of the bars) is 1/trun = 6.06 × 10⁻⁵, 2.08 × 10⁻⁴, and 1.35 × 10⁻⁴ and the Nyquist frequencies are 1/(2Δt) = 0.151, 0.247, and 0.147, where Δt is the average sampling cadence.
Other Images in This Article
Show More
Copyright and Terms & Conditions
© 2026. The Author(s). Published by the American Astronomical Society.

