Image Details
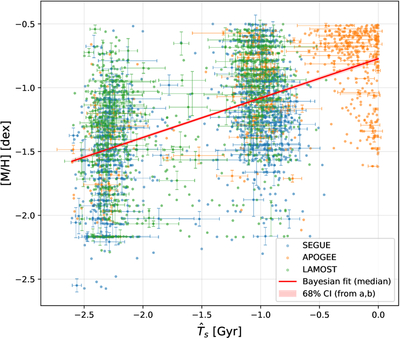
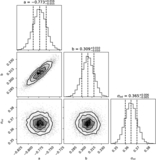
Caption: Figure 4.
The x-axis shows NN-predicted stripping time ﹩{\hat{T}}_{s}﹩, and the y-axis shows metallicity. Blue, orange, and green dots correspond to data from SEGUE, APOGEE, and LAMOST. The red line shows the metallicity gradient, with the shaded region representing the 1σ credible interval.
Other Images in This Article
Copyright and Terms & Conditions
© 2026. The Author(s). Published by the American Astronomical Society.
Copyright ©
2026 Astronomy Image Explorer. All Rights Reserved.