Image Details
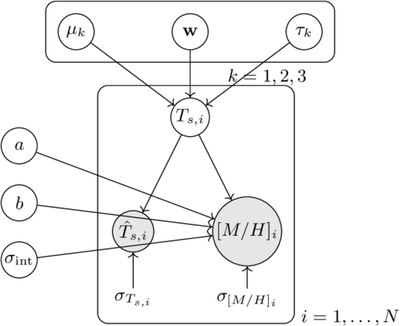
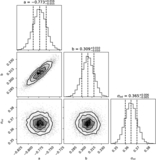
Caption: Figure 3.
Directed acyclic graph (DAG) for our hierarchical Bayesian mixture-plus-regression model. Latent variables are shown as unfilled circles, observed quantities as filled gray circles, and fixed parameters are shown in rectangles. The model infers the true stripping time Ts,i from the NN prediction ﹩{\hat{T}}_{s,i}﹩ and its uncertainty ﹩{\sigma }_{{T}_{s,i}}﹩. A Gaussian mixture model with three components (k = 1, 2, 3), parameterized by weights w, means μk, and standard deviations τk, describes the distribution of stripping times corresponding to the three main pericentric passages of the Sgr Stream. The metallicity [M/H]i is modeled as a linear function of the true stripping time with slope b, intercept a, and intrinsic scatter σint, observed with measurement uncertainty σ[M/H] i. The plates indicate replication over N stars (bottom) and the three mixture components (top right).
Other Images in This Article
Copyright and Terms & Conditions
© 2026. The Author(s). Published by the American Astronomical Society.