Image Details
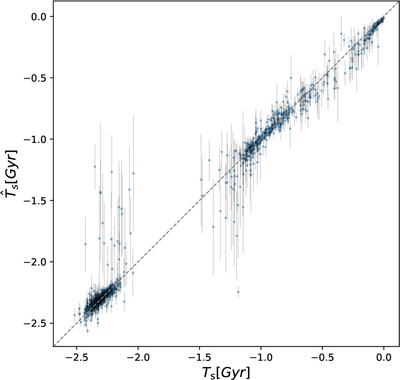
Caption: Figure 1.
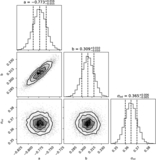
Results on the test set. The x-axis shows the true stripping time Ts of V21 simulation particles, and the y-axis shows the stripping time predicted from the NN (﹩{\hat{T}}_{s}﹩). Blue dots with error bars correspond to the adopted value and uncertainty of the NN-predicted results. The gray dashed line corresponds to y = x.
Other Images in This Article
Copyright and Terms & Conditions
© 2026. The Author(s). Published by the American Astronomical Society.
Copyright ©
2026 Astronomy Image Explorer. All Rights Reserved.