Image Details
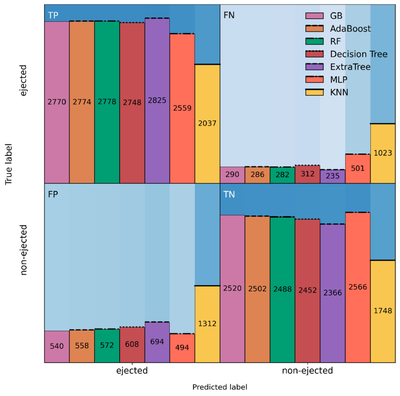
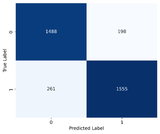
Caption: Figure 5.
Confusion matrices for seven classification models shown in a unified 2 × 2 layout separating true positives (TP), false negatives (FN), false positives (FP), and true negatives (TN). Colored bars denote individual models, ordered by decreasing the overall performance from left to right, with bar heights normalized by the total number of objects in the corresponding true class. Numerical annotations indicate absolute counts in each cell.
Other Images in This Article
Copyright and Terms & Conditions
© 2026. The Author(s). Published by the American Astronomical Society.
Copyright ©
2026 Astronomy Image Explorer. All Rights Reserved.