Image Details
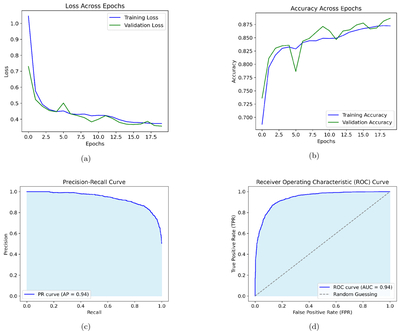
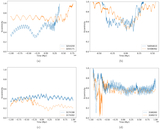
Caption: Figure 6.
Model performance summary. (a) Training and validation loss as a function of epoch, illustrating rapid initial convergence followed by gradual stabilization. (b) Training and validation accuracy across epochs, showing consistent improvement and convergence between the two sets. (c) PR curve on the test set, characterizing the trade-off between precision and recall; the shaded region represents the area under the PR curve, providing a summary measure of classification performance. (d) ROC curve on the test set, showing the true positive rate as a function of the false positive rate; the shaded region denotes the area under the ROC curve (AUC), which quantifies the overall discriminative capability of the model, while the diagonal line corresponds to random-guess performance.
Other Images in This Article
Copyright and Terms & Conditions
© 2026. The Author(s). Published by the American Astronomical Society.