

Image Details
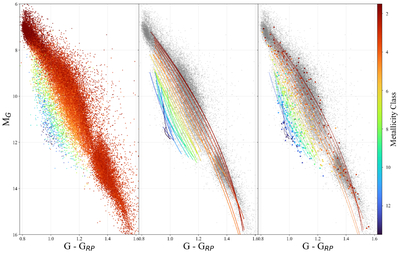
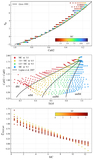
Caption: Figure 16.
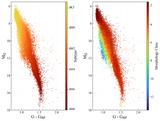
Left panel: classification results across the H–R diagram according to the MC parameter. Metal-rich stars are represented in red, and the most metal-poor stars are represented in blue/purple. Middle panel: metallicity tracks across the H–R diagram for each MC. Each line represents a second-order polynomial fit to the median color and absolute magnitude of each ST in an MC bin. The metal-rich tracks are well separated along the majority of the main sequence, and we hope to improve the overlap of the most-metal-poor tracks with additional subdwarfs in future surveys. Left panel: best possible benchmark stars for each template grid point overplotted onto the median metallicity tracks. Benchmark stars are selected using the star with the brightest Gaia G-band magnitude, a high-quality template fit, and no evidence of Hα emission.
Other Images in This Article
Show More
Copyright and Terms & Conditions
© 2026. The Author(s). Published by the American Astronomical Society.

