

Image Details
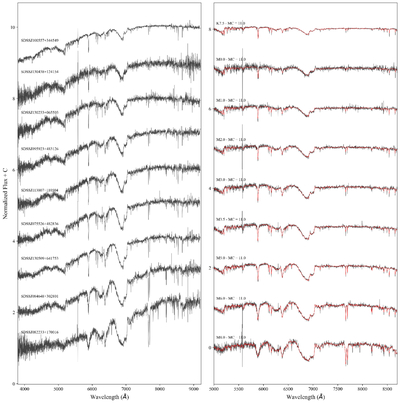
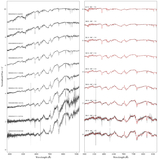
Caption: Figure 7.
Left panel: normalized spectra from nine early- to late-type M subdwarfs. As in Figure 6, we display objects of varying spectral subtype but highlight significantly metal-poor objects in this figure. The SDSS names are indicated above each spectrum. Right panel: rectified spectra from the left panel (black), with their best-fit rectified template (red) overlaid, with the specific template subtype and morphology class values listed above each spectrum-template combination. The templates are once again well representative of the given molecular band strengths for their given spectra. Additionally, because metal-poor objects tend to be fainter, the S/N of their spectra is typically lower. The well-fit templates here highlight the capability of this template-fitting method to accurately determine the subtype and morphology class for noisy spectra.
Other Images in This Article
Show More
Copyright and Terms & Conditions
© 2026. The Author(s). Published by the American Astronomical Society.

