

Image Details
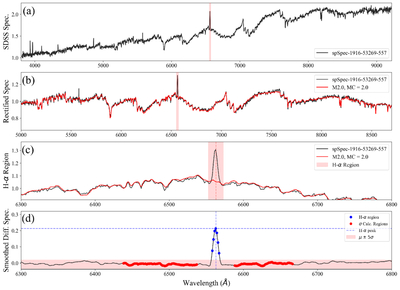
Caption: Figure 9.
Procedure for identifying active K/M stars from SDSS spectra. Panel (a): an example of a typical mid-type, fairly metal-rich M dwarf SDSS spectrum in the sample. Panel (b): the rectified spectrum (black) and its best-fit classification template (red), also rectified. The red vertical box highlights the Hα emission. Panel (c): zoom in on the region around the Hα emission feature. Again, the red shaded box highlights the Hα emission. Panel (d): smoothed residuals after subtraction. The blue region represents the range of wavelengths in which we search for an Hα excess. We calculate the instrumental noise in the red regions surrounding the Hα region and compare the peak Hα excess to this value. The red shaded box is ±5σ from the mean of the surrounding regions where the noise is measured. If the peak of the blue pointed regions lies above this shaded box, the star is considered active.
Other Images in This Article
Show More
Copyright and Terms & Conditions
© 2026. The Author(s). Published by the American Astronomical Society.

