

Image Details
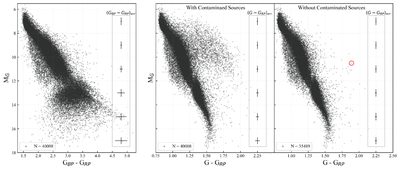
Caption: Figure 2.
Left panel: Gaia GBP − GRP color–magnitude diagram of Sample F of stars that have matching Gaia DR3 parallax and photometry measurements. A 10% relative parallax cut takes our sample of 109,276 stars down to 40,008 stars. The average color error for several absolute magnitude bins is shown on the right side of the panel. The errors in color increase as luminosity and temperature both decrease. Middle panel: Gaia G − GRP color–magnitude diagram of the Sample F of stars with reliable parallax measurements. The average color errors in this color space are more consistent between color bins and lower for the lower-mass objects. The large cloud of stars extending to the red likely comprises stars contaminated by chance alignments in the field or barely resolved binaries. Right panel: Gaia G − GRP color–magnitude diagram of the sample where sample sources that have another source in the field within 3″ have been removed. Some stars with unusually red colors remain in the sample, but we have found these to likely be special cases, and they are left in our sample. The star circled in red is an example of one such object and is discussed further in Figure 3. This collection of 35,489 stars is the final sample (Sample C) we use for most of our analysis. The sample includes a wide range of stars with different metallicities, from metal-rich dwarfs to metal-poor subdwarfs.
Other Images in This Article
Show More
Copyright and Terms & Conditions
© 2026. The Author(s). Published by the American Astronomical Society.

