

Image Details
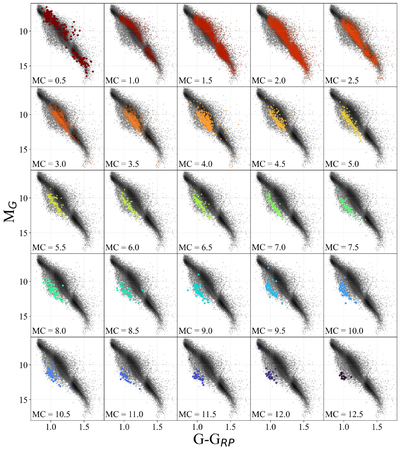
Caption: Figure 14.
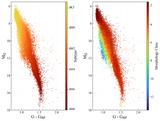
The color–magnitude diagrams above highlight the distributions of stars in each morphology bin in our classification scheme. The most metal-rich bin is highlighted in the top-left panel proceeding to the most metal-poor bin in the bottom-right panel. Most of the stars in the sample are classified as metal-rich stars (MC = 0.5–2.5), while fewer stars are classed as metal-poor to ultra-metal-poor dwarfs (MC = 3.0–12.5). In general, the bands of decreasing MCs move from the top of the main sequence to the bottom of the main sequence, where the most metal-poor subdwarfs are located.
Other Images in This Article
Show More
Copyright and Terms & Conditions
© 2026. The Author(s). Published by the American Astronomical Society.

Copyright ©
2026 Astronomy Image Explorer. All Rights Reserved.
